Short to mid-term reporting plays a huge role in the lives of Planners and Engineers. Done properly, it can streamline your workload, remove unnecessary problems, drive site performance, and generally make life in construction much smoother.
And yet,
For some reason, there seems to be an inordinate amount of confusion and miscommunication around best practices.
Topics that should be simple to look up and learn about have little to no resources. Information is scattered and it’s needlessly complicated to brush up on reporting methods and sharpen your skill set.
If you’ve ever found yourself spending way too much time looking for examples of weekly reporting routines, or a decent explanation of production rates, then this guide was written for you.
- Reporting Routine
- KPIs You Should Be Using
- Earned Value Management
- Percent Plan Complete
- Root Cause Analysis
- Download The Guide
Reporting Routine
Without structure and routine, construction projects can quickly become a nightmare to manage. Sporadic and unplanned meetings lead to a breakdown in communication; site teams end up working in silos and the project quickly becomes a headache for engineers and project managers to keep track of.
By implementing short term planning and a weekly reporting routine you’ll be able to monitor the day-to-day activities of a project and proactively drive site performance.
Weekly routines for construction
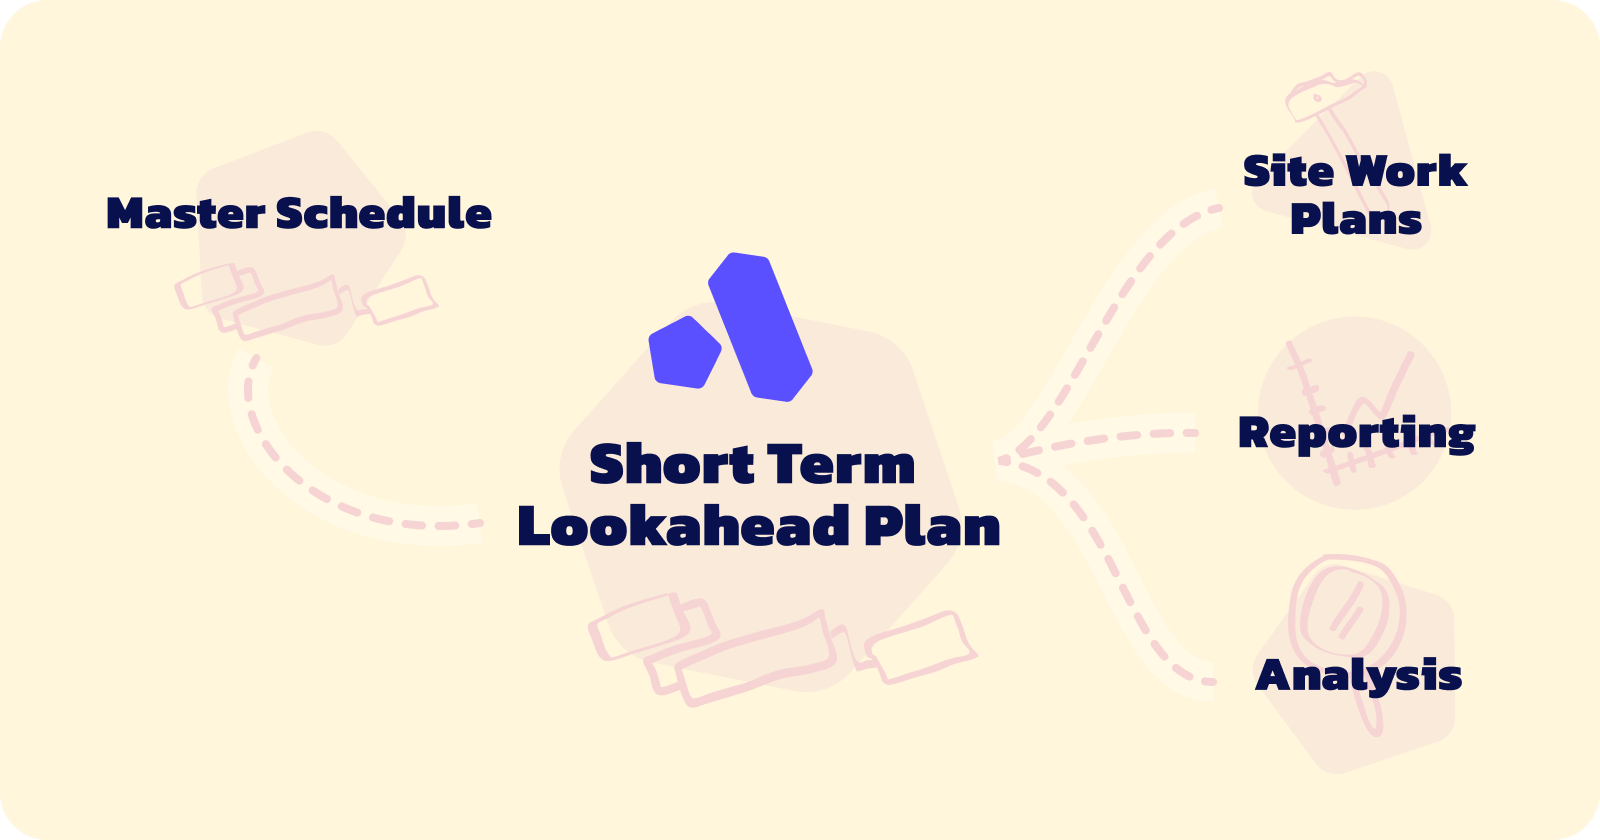
A strong weekly reporting routine consists of a structured series of meetings and activities which religiously take place every week. This ensures that there is a standardised process across the entirety of the project and that reporting is consistent from start to finish.
These meetings ensure a greater level of collaboration between teams, helping to identify potential issues and improve the performance of the overall project. The weekly routine also enables the production of strong, well-informed, short term plans.
Why short term plans are beneficial to your project
By creating more granular, short term (weekly) plans, engineers and project managers are able to review the performance of a project on a more frequent basis. This helps identify issues sooner than would otherwise be possible with a more traditional approach.
Ultimately, short term planning provides a greater understanding of the project, reduces delays, and prevents you from overspending on projects.
What does a weekly reporting routine look like?
Discussions normally take place across a series of performance review, and team co-ordination meetings, which a held in a 'war room'. The process includes the participation of Construction Managers, Superintendents, Foreman, Planners, and Engineers at all levels. Although this is not an extensive list and it may often require the input of various other team members.
Whilst it might look slightly different from one construction project to the next, the processes and timeframes normally look something like this:
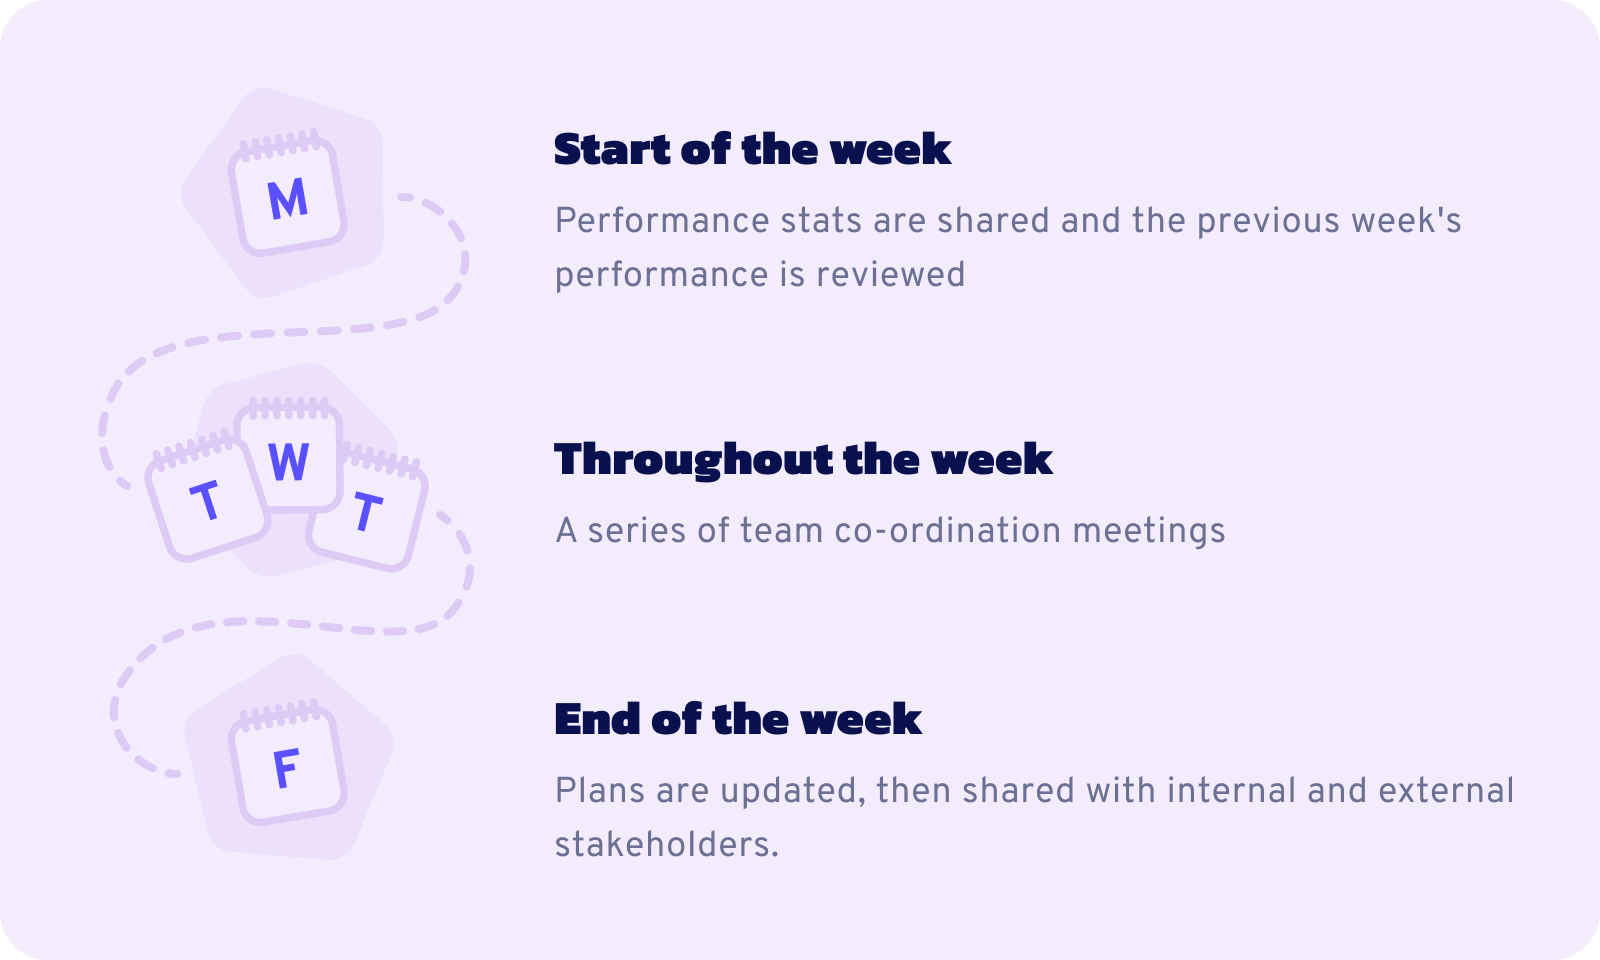
An example of how this looks in action:
Monday
Project Engineers, Site Engineers, and Foreman will discuss the previous week's work. This is an ideal time to discuss any issues or concerns for the week ahead.
Tuesday
A Weekly interface meeting is held for separate structures and teams to come together, collaborate, arrange handover dates, and mitigate potential clashes.
Wednesday
Senior Project Engineers host co-ordination meetings. Whilst topics may change from week to week, the agenda will normally include:
- Last week’s activities
- The success rate of those activities
- Delays and issues
- An up-to-date view of the programme
- A review of target dates for the coming weeks
- Issues and concerns for the week ahead
- Duration and requirements for the planned work
- Future works and considerations for upcoming work (typically around 12 weeks)
Thursday
A performance review meeting is held by the Construction Manager and attended by the Superintendent, Senior Project Engineers, and the Area Planner. Again, the specifics might vary from one project to another but the activities usually look something like this:
- The Area Planner produces a Target Programme that highlights the remaining activities for the upcoming 12 weeks.
- Each activity due to take place over the next 12 weeks is to be reviewed line by line and the relevant SPE should advise on any required amendments.
- Critical and subcritical paths from the target programme are then reviewed separately so that senior team members can focus on critical activities.
- Key Milestone Dates are reviewed.
- The Production Control Dashboard is reviewed.
- Root causes for failed tasks are investigated.
Friday
Project Engineers produce an updated weekly programme which should be based on the team discussions and interface meetings held during the week. This includes actual data from the week prior and the next 3 weeks of the look ahead plan.

KPIs You Should Be Using
Short to mid-term reporting can seem a little hectic sometimes. With every project doing things a different way and so many potential metrics to track, it’s hard to know what’s worth investing your time into.
That’s why we’ve narrowed down four of the most important KPIs you should consider using. Whether you’re a planner or an engineer, each of these four construction KPIs will help you build a clearer picture of your project and improve site performance.
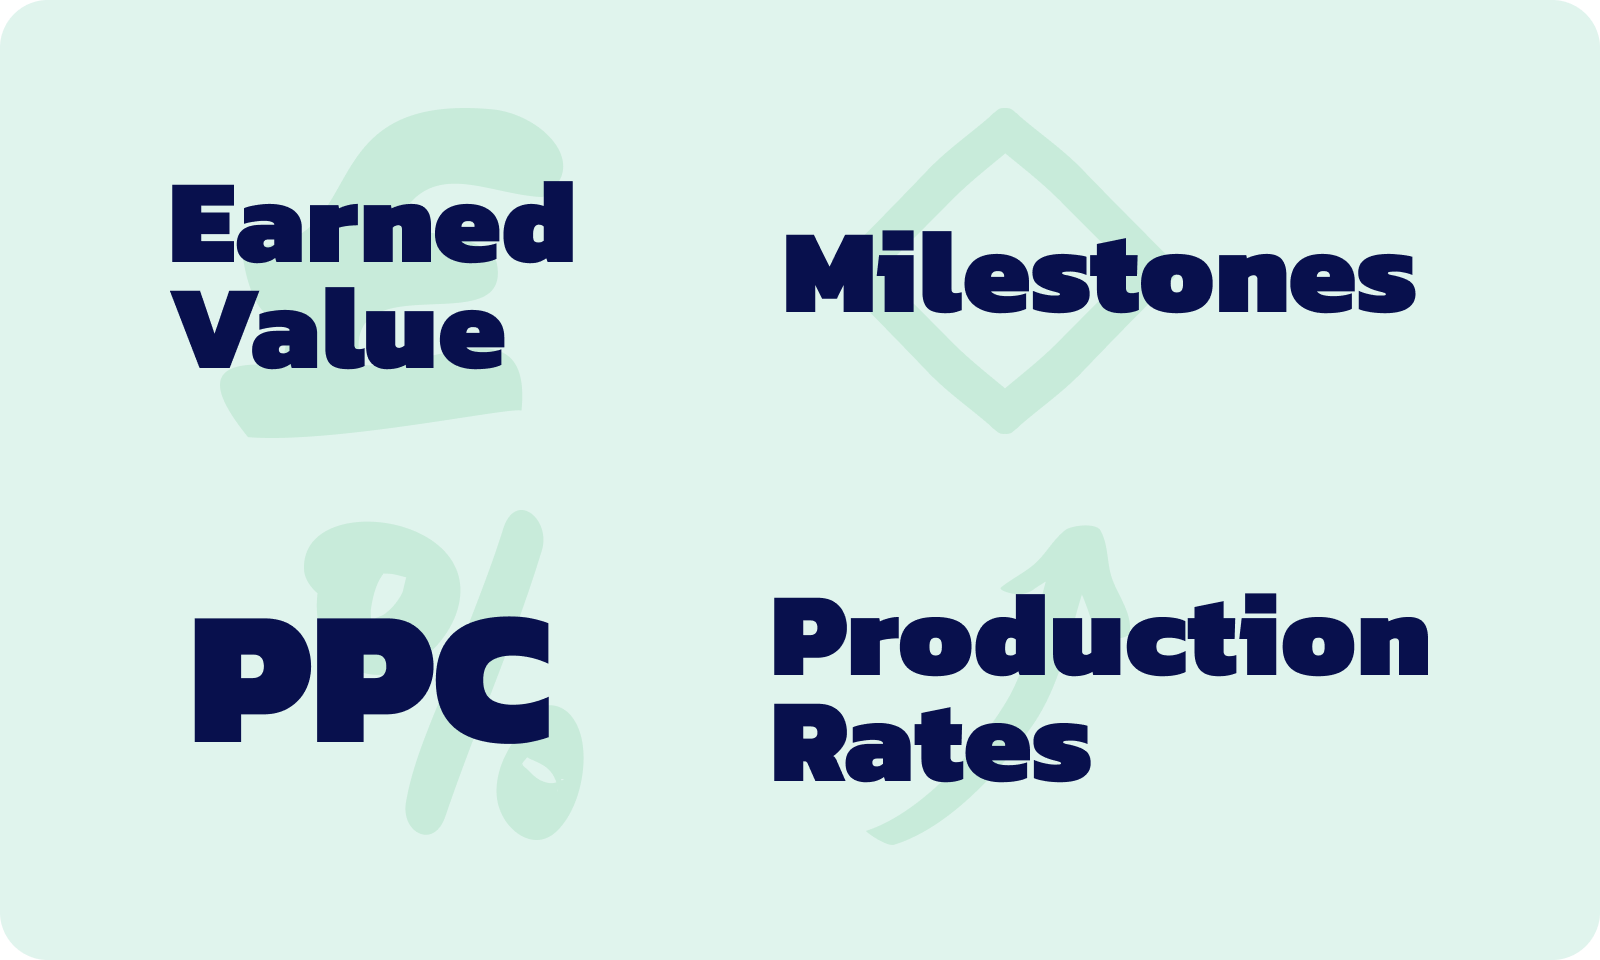
Milestone Tracking
Even if you’re not familiar with the term Milestone, you are almost certainly using them. Milestones are simply a selection of key dates put in place to be tracked over the course of a construction project.
Common Milestones include things like project start and end dates, sectional completion dates, and handover dates.
- Sectional completion dates are the agreed timings for specific tasks or work areas to be completed.
- Handover dates are the agreed timings for an area of work to be passed from one team or trader to another (e.g the date that an electrician will leave a work area and the decorator will start on that area).
Milestone Variance refers to the delay or early completion of a job that has been given a key date. It’s important that you track and monitor variance as this can have a knock-on effect on the rest of the project.
Whilst there are many ways of tracking variance, you will usually find it presented in some form of a spreadsheet dashboard. It’s a relatively simple process as you just need to know the key dates and the number of days that you are behind, or ahead of schedule.
Earned Value Management
Earned Value Management (EVM) is an analytical tool used in construction to track the progress of a project and compare it against your predicted schedule or budget. You can then use that information to make project forecasts, manage potential risks, and avoid costly delays.
The way it works
Initial project time frames and budgets (as laid out in the Work Breakdown Structure) are used as a baseline to measure performance throughout the project. As the project progresses, you compare the amount of work completed and/or budget that's actually been spent in comparison to your initial plans.
This can then be taken a step further by analysing any variance and investigating the reason for delays and/or additional costs.
Doing this on a regular (often monthly) basis will help you monitor the status of your project. From here you can instigate measures to keep it on track.
This topic is covered in more detail later the guide.
Percent Plan Complete (PPC)
Percent Plan Complete (PPC) is used to quantify the success rate of your project so that you measure, and improve site performance.
Traditionally used in lean management systems, this simple, yet effective tool can be easily applied to any project.
The concept works by committing to specific ‘shifts’ at the start of the week - then reviewing how successful those committed shifts were at the end of the week. From this information, you can calculate a percentage of success and quantify your performance.
The routine of committing to and tracking the success or failure of shifts also lends itself to identifying potential issues and carrying out root cause analysis.
Again, because this is a more detailed subject, we’ve given it a more thorough explanation further on in the guide.
Production Rates
Tracking Production Rate is incredibly useful when you are working on repetitive or linear jobs, such as earthworks or drainage.
This is because these kinds of jobs are less likely to be broken down into smaller tasks. Therefore, you’ll likely find it very difficult to stay on schedule and avoid overspending. That's where production rate can help.
How does it work?
By recording the amount of resources used and installed each day, you can estimate the cost of installation.
For example:
You need to lay 5km of waterpipe in 2 weeks (10 working days).
This breaks down to an average of 500m per day that needs installing.
By tracking the meteres installed each day and the cost of the resources used, you can calculate the cost per meter.
Cost of resources used ÷ Quantity of materials installed
By comparing that figure to your budget, you can track whether or not you are overspending on resources.
Earned Value Management
Have you ever wondered how large, complex engineering projects manage to monitor budgets, oversee progress, or stay on schedule? Construction sites often run on tight deadlines and narrow budgets, so it’s important that project managers have the right tools to keep everything on track.
Introducing Earned Value Management (EVM) and Earned Value Analysis (EVA).
If you’re not familiar with these terms then fear not - we’ve covered everything you need to know in the next few paragraphs.
What is Earned Value Management?
Earned Value Management (EVM) was first established by the US Department of Defence in the 1960s and has since been widely adopted by project managers in different industries across the globe. In short, it’s a model of analysis that allows you to track the progress of a project in comparison to the initially predicted schedule and/or budget.
As you can imagine, this is particularly useful for planning and managing large, intricate construction projects. With so many moving parts, materials, tasks, and operatives to keep track of, project managers need to be able to track progress against planned budgets and schedules.
Why is EVM so important?
Effectively carrying out earned value management will answer three crucial questions about the progress of any construction project.
- Where should we be at this point in time?
- Where are we at this point in time?
- Where will we be if we carry on this way?
Being able to answer these questions confidently (and with data) will enable you to keep senior management and other stakeholders well informed on the progress of the project. More importantly, knowing this information helps manage potential risks and avoid deviating from initial plans and budgets.
How is EVM implemented?
Before construction begins, the project manager will agree on the scope of the work that needs to be completed and create a work breakdown structure (WBS).
Each package (group of tasks) within the WBS will be allotted a specific budget and time frame for completion. This plan is then used as a baseline (referred to as Planned Value or PV) which, in turn, is used to monitor progress throughout the completion of the project.
Initial budgets and time frames are built from industry averages and experience from previous projects. It is essential that these are as accurate as possible as deviations can determine whether or not the overall project is profitable.
As work is carried out on each package, the completed tasks become Earned Value (EV) and are used to calculate progress in comparison to the baseline budget and schedule. Delays and deviations from the initial plan can then be addressed, corrected, and planned for.
How to carry out Earned Value Analysis
Now that you understand what EVM is and how it’s used, you’ll probably be itching to find out how it’s done. Fortunately, the theory behind the analysis is fairly simple and you’ll just need the following metrics to get started.
BAC (Budget at Completion)
The original budget assigned to complete the package or task.
AC (Actual Cost)
The exact amount that has been spent to date.
EV (Earned Value)
How much the task should have cost so far
Calculated as:
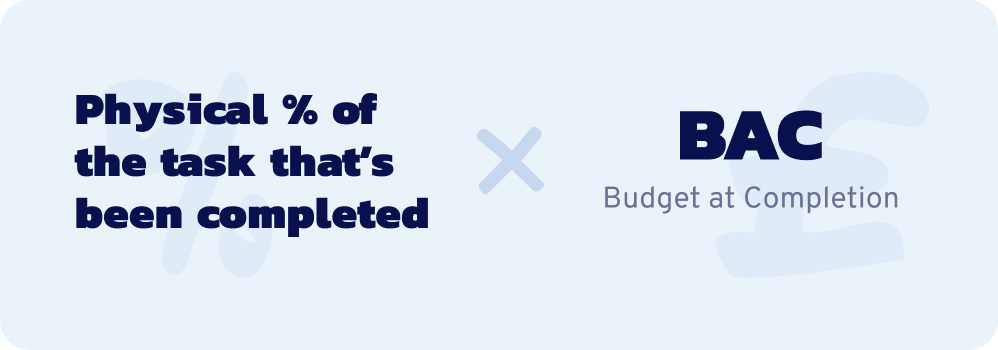
To simplify:
A budget of £2000 has been estimated for the installation of 10,000 bricks
To date, 4000 bricks have been installed (40% of the overall task)
The EV is then 40% (percentage of the task complete) x £2000 (BAC)
EV = £800.00
What next?
Using the above formula you should now have an idea of how far along the project is, how much you’ve spent, and how much you theoretically should have spent to date.
The great thing about EVM is that you can add another level of detail by mapping this information out on a chart and comparing your EV against the PV at specific points in time. This is usually carried out at regular (often monthly) intervals so that potential issues and deviations can be managed as soon as possible.
Calculating Variance
If you want to delve even deeper into variances and deviations, you can use the following formulas to calculate schedule variance and cost variance.
Schedule Variance = EV - PV
Cost Variance = EV - AC
When working on schedule and cost variance it’s important to remember that positive values indicate being ahead of schedule or under budget; negative values indicate that the project is behind schedule or over budget. Anything with a value of 0 is on schedule or budget.
Measuring Project Efficiency
Schedule Performance Index (SPI) and Cost Performance Index (CPI) can be used to calculate project efficiency by assigning a numeric value.
To calculate each you’ll need the same metrics used to calculate variance.
The formulas:
Schedule Performance Index = EV/PV
Cost Performance Index = EV/AC
Percent Plan Complete (PPC)
Making sure short terms plans are carried out with as few delays as possible is essential to keeping your project on track. To do that effectively, you need a way of measuring the success rate of your plans and discovering potential issues.
Here, we’ve outlined one of the most widely adopted methods of quantifying, analysing, and improving the success rate of short term plans.
What is Percent Plan Complete?
Percent Plan Complete is a construction management tool that’s used to assess how effectively your short term plans are being implemented.
At a surface level, it allows you to quantify the performance of a construction site by comparing the number of shifts planned at the start of the week, to the number of shifts successfully completed at the end of the week. From that, you are able to gauge how smoothly your project is running on a day-to-day basis and identify potential areas of improvement.
The important thing to understand about PPC, is that it’s real benefits come from unearthing problems on site and holes in your short term plan.
By questioning ‘WHY’ shifts aren’t going to plan you’ll discover recurring reasons for delays that you can then take action on. Doing this on a regular basis will allow you to make frequent adjustments, prevent missing milestones, and ultimately help keep the master plan on schedule and budget.
How to work out PPC
Like many other construction reports and metrics, the theory behind calculating Percent Plan Complete is really quite straightforward.
The Formula
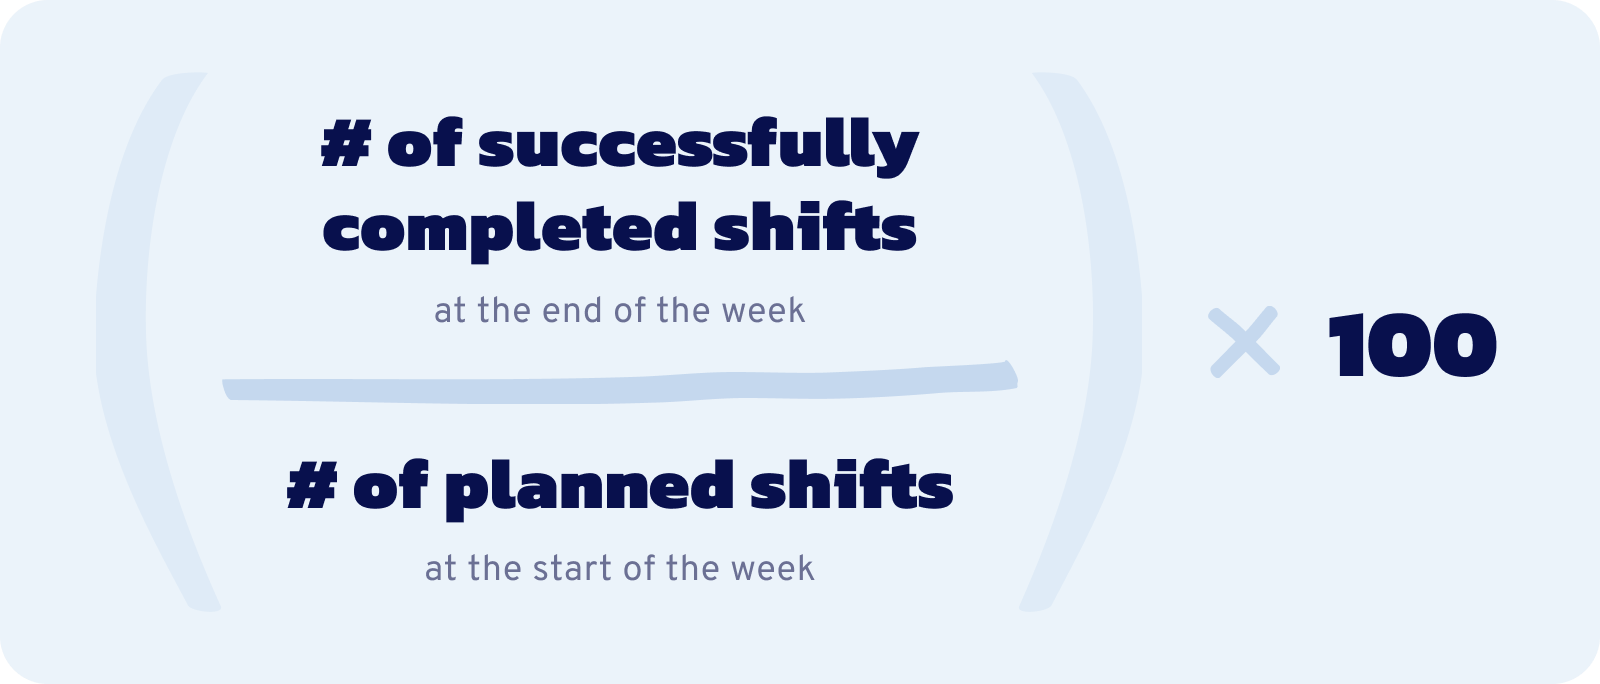
Example
At the start of the week, you planned five shifts
Three shifts were successfully complete
Two were unsuccessful (due to plant failure)
3 / 5 = 0.6 x 100
PPC = 60%
This metric will start to give you some idea of how well organised your project is. If only 60% of the shifts you plan are successful then there are clearly some underlying issues that need to be addressed.
Every time a shift is unsuccessful you should be collating information about why the shift did not go to plan. The issues can then be resolved and your PPC score should improve.
Getting the most out of PPC
Remember, the real value of PPC comes from unearthing underlying issues and being able to respond to them before they cause major delays.
For the best output, you should aim to create an environment where operatives feel comfortable reporting failures. Doing this will allow you to identify recurring problems, carry out root cause analysis, and resolve deeper problems on the project.
When it comes to the math, you should not be aiming to hit 100% (because that would mean that the team aren’t pushing themselves). The goal is to strive for slow, incremental improvements over time; an initial target of 75-80% might be a good starting point.
You should also bear in mind that your target percentage may have to be reviewed and adjusted periodically. If you are constantly completing all of your planned tasks then it is likely that there is scope to achieve more. If the team is frequently struggling to keep up with the number of planned tasks then the team may be stretched too thin or the plans may be too ambitious.
Putting PPC into practice
Whilst the theory is simple, PPC has historically been a difficult and arduous task to carry out.
The first challenge is collating all of the information from site operatives and tradespeople. In the past, this has been a very manual task that requires team huddles and frequent follow-ups with various individuals (often via different mediums). Trying to manage this at scale can be difficult but the information gathered is incredibly valuable.
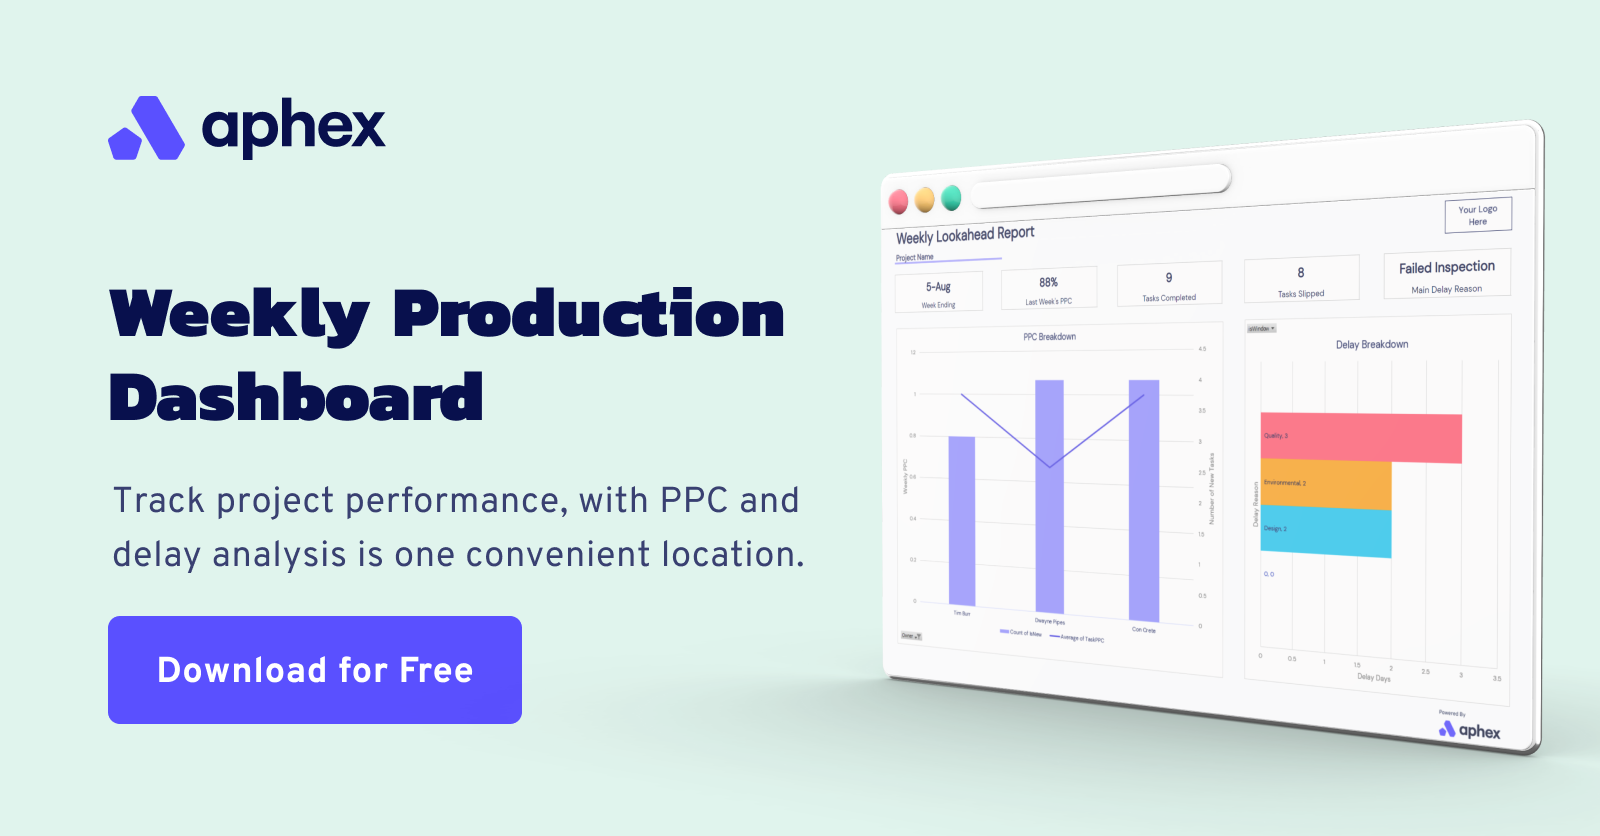
The second challenge is trying to collate and analyse all of the information once you’ve obtained it. Fortunately, the introduction of new tools and technology like Aphex and Power BI has made this process much easier.
However you decide to go about putting PPC into practice, the model is bound to vastly improve the productivity of your project.

Root Cause Analysis
Root Cause Analysis is a project management tool used to identify underlying issues that cause or contribute towards delays in construction.
Unfortunately, on many jobs, you may not realise the impact of day to day problems until it is too late. There is a delay on the project, milestones are moved and a surface-level causation (such as weather) is attributed as the reason why.
However, more often than not there will be a number of contributing factors that could have been prevented before the situation got out of hand.
When carrying out Root Cause Analysis, you question ‘why’ individual tasks and shifts are unsuccessful. Using that information you can then resolve the problem, prevent delays and help keep the project on track.
Why should you be using Root Cause Analysis?
Delays in construction cost both owners and contractors a lot of money. Timelines have to be moved, new resources allocated and it’s ultimately a headache for everyone from the Project Director to the Engineers on site.
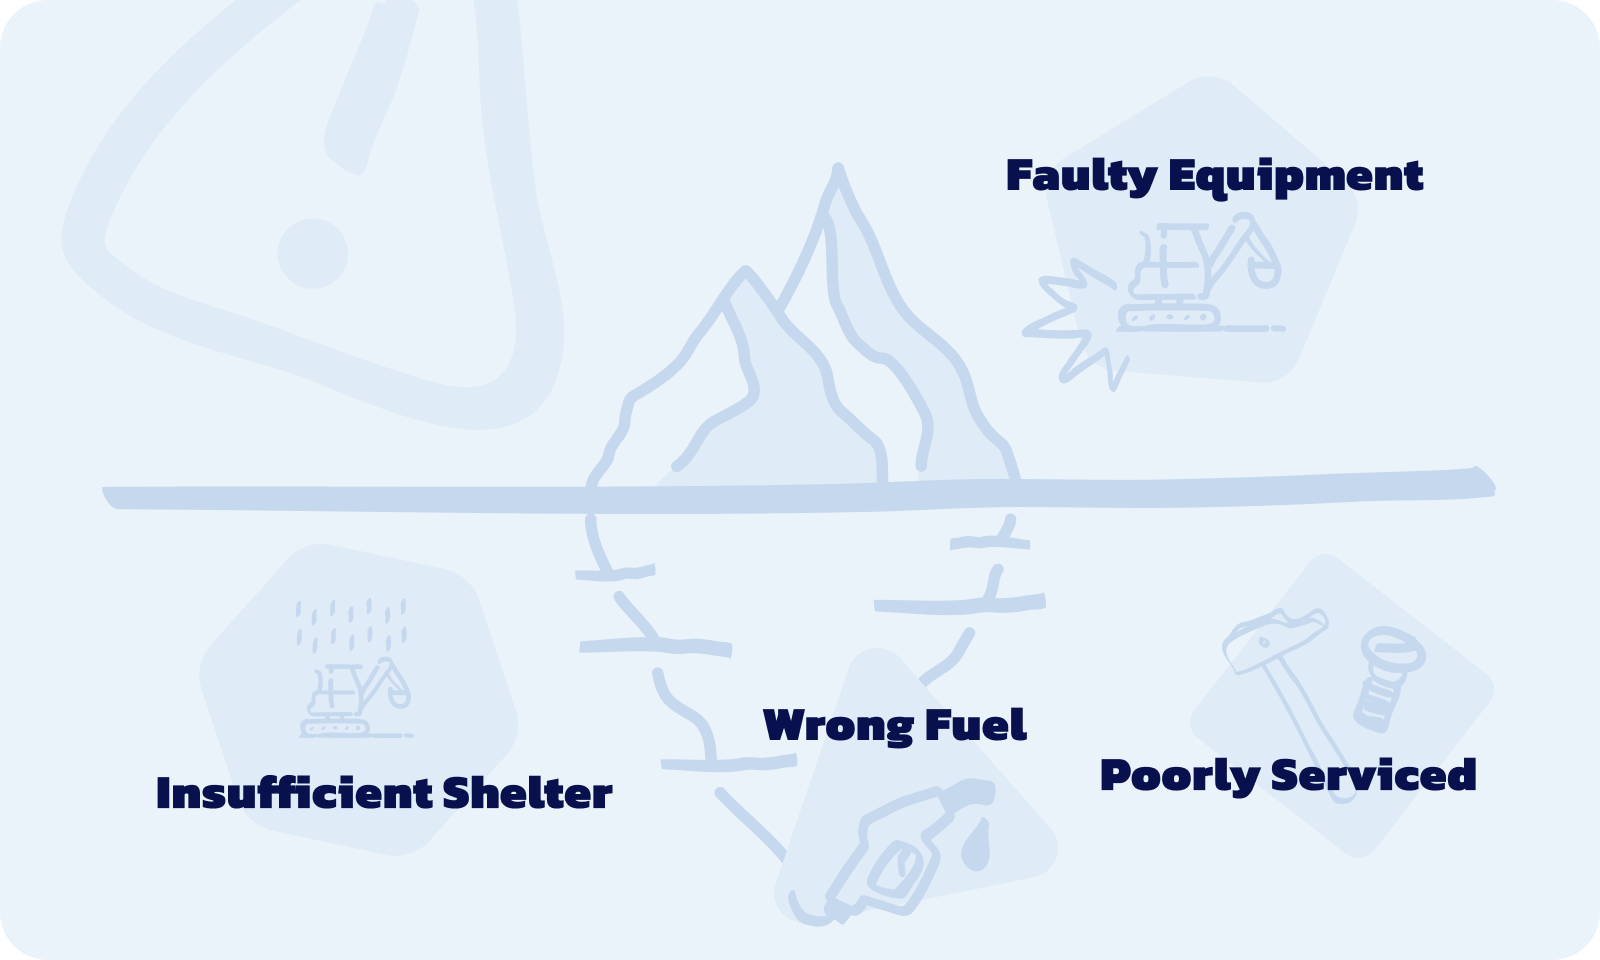
The reason this is a flawed approach is that the attributed cause for these costly delays is normally just the tip of the iceberg. By taking a closer look at why your planned tasks are unsuccessful, you can arm yourself with a deeper understanding of what’s really going on, and prevent potential problems.
Let’s say you are an engineer on a project. You’ve put a short term plan in place with specific goals but you have a number of unsuccessful shifts because of faulty equipment. This continues and compounds, ultimately causing a delay on the critical path. The attributed causation is faulty equipment.
Now let’s say that on that same project you carried out root cause analysis, logged every failed task, and investigated the problem further. You may discover that there is insufficient shelter on site and equipment is being left out in the rain, equipment is not being serviced as often as it should be, or the wrong fuel is being used. Armed with this knowledge you can now resolve underlying issues before they amount to something more severe.
In an ideal world, you’d be able to prevent mistakes like this before they ever occur. Unfortunately, the reality is that you just can’t plan for the unforeseen. The next best thing to do is find the root cause of problems and future proof job as it progresses.
Getting Started
The first step is to start taking note of all your delayed shifts and failed tasks. You can do this using anything from spreadsheets to a notebook. If you are using Aphex to build your short term plans all of your delays and reasons for failure are captured and tracked on your Gantt chart.
One of the more popular ways of tracking task completion is the Percent Plan Complete method. This will help you build an ongoing picture of your task success rate so that you can aim to improve it over time. The important thing to remember is that in order to improve your success rate and reduce potential delays you need to be identifying root causes.
However you decide to track failed tasks, the concept is the same - commit to specific actions and deadlines, then take note whenever those actions aren’t carried out or deadlines are missed. Every time this happens you should be investigating why your plans aren’t successful.
Taking action
Root Cause Analysis will help you identify issues on a project but this information is useless if you don't take action. The next step is to remove the root cause.
Every issue you discover needs to be addressed.
The final thing to note is that root cause analysis is not a one-time deal. You should be investigating, analysing, and resolving issues throughout the lifespan of the project and on every failed task or shift.
Do this correctly and you will help save the project from costly delays and yourself from complicated problems and headaches.

Before You Leave
Thanks for reading! If you enjoyed this post and would like to receive future articles and guides directly to your mailbox then sign up to our blog below.
.png)